Daily Chemical Reaction
The Locomotion – Global Chemical Supply Chains Far From Normal, Product Availability Improves
Key Points:
- Global chemical production indicators suggest rising product availability. Though most supply chains remain imbalanced, we comment on why lower US commodity chemical prices are likely in 2022 and other relevant trends.
- We discuss pertinent chemical sector updates (e.g., Methanex, Braskem, Linde, Petrobras, Tessenderlo, PTT Group, Ineos, Lukoil, & others).
- We note relevant ESG items worth notice, ranging from EU carbon values to CCUS development trends. We also highlight our latest ESG thematic research Carbon Prices – Inequitable and Uncertain – Not What We Need.
- We discuss numerous other pertinent chemical sector items in this report.
See PDF below for all charts, tables and diagrams
Client Login
Learn About Our Subscriptions and Request a Trial
Contact us at cmaccinsights@c-macc.com to gain full access and experience our services!
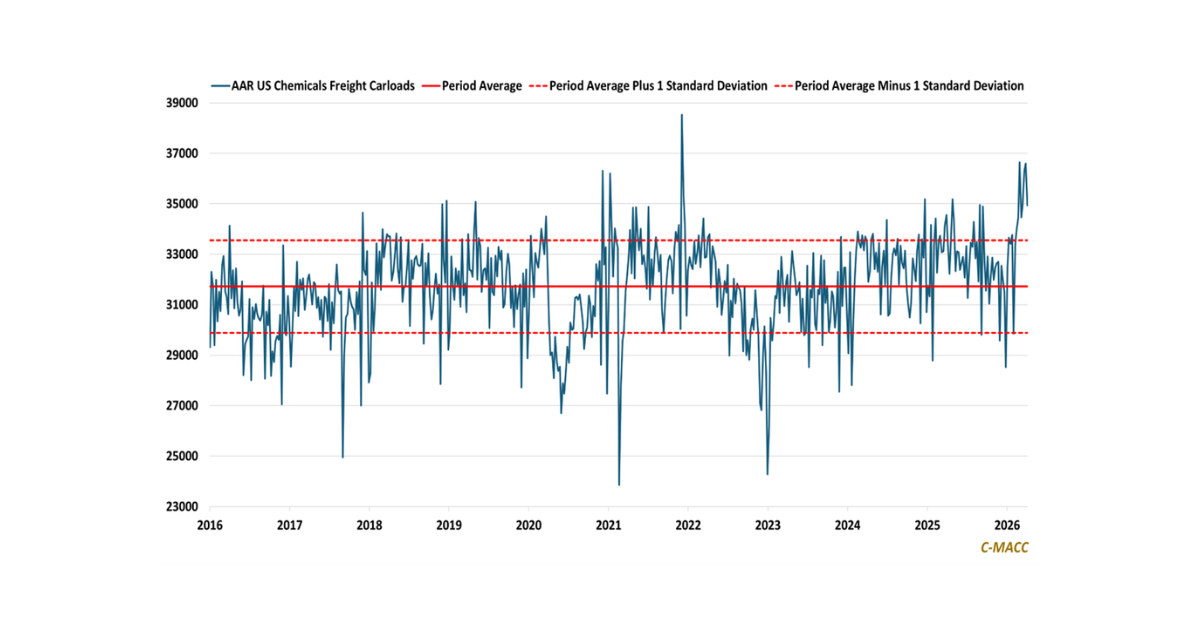
Exhibit #1: US Chemical rail volume grew modestly WoW but remain at the high-end of the five-year range for the time of year. The multi-week volume trend remains positive. We expect continued trend support in 4Q21 and model US (& North American) shipments in the December quarter of 2021 at or above 2019 levels. This report discusses US (& North American) rail volume developments and other relevant chemical sector trends.

Source: AAR, Bloomberg, C-MACC Analysis, November 2021
General thoughts. At the close of the week, a trend standing out to us is the evidence of improved chemical product flows in the US. This trend is significant because the US is a premium-priced commodity chemical market relative to Asia, where product availability is less of an issue. Improving US supply will put downward pressure on domestic prices. We find evidence of downward pressure in polymer chains already occurring, such as in polypropylene (PP). We highlight methanol as also set to see a downward move in contract prices MoM in December and flag monomer price support that is being driven near-term more by elevated demand and higher polymer production rates relative to feedstock price movements. With greater production in motion, the next logical question is whether the product can arrive at customers. We find significant issues at US ports but find most of this is based on problems with importing products. Based on this, higher domestic production rates and product flow in the US, a country that exports a significant share of its polymer production, will put downward pressure on US commodity prices from within. We do not anticipate a substantial price decline until the lower-priced imported product becomes available. Indeed, a shock to demand caused by a shift away from durable products or as a result of another COVID variant shock could further shift global supply chains, but we think more indicators suggest healing than provide evidence of further imbalances currently. Other items of note in this report include the EU carbon price hitting a record this week. We highlight our weekly ESG report on this market titled Carbon Prices – Inequitable and Uncertain – Not What We Need. This report also comments on the IEA work on CCUS developments, and we highlight numerous industry demand items worth consideration in 4Q21. All in, we anticipate strong 4Q21 chemical sector results YoY but our views remain cautious for 2022.
Energy/Upstream:
As we go to press today we are looking at a collapse in the stock market and a collapse in crude oil prices, both fueled by a renewed COVID concern. The new variant that has emerged in South Africa is causing countries to impose travel restrictions and there are talks of further lockdowns. Crude oil is falling more on this news than on the news that several countries will release reserves as there is an expectation that economic growth will be hit by the new wave. Airline stocks are down more than 10% today as travel is again expected to face restrictions. The sharp contrast with natural gas prices which are higher today in the US is because natural gas is much more of a stay-at-home fuel than crude oil, and the weekly inventory numbers showed a drawdown, albeit not large.
Separately, it is interesting to see ethane weakening relative to natural gas – Exhibit 3. We have two ethylene plants in start-up right now, which should add to ethane demand, as well as additional demand for export to Mexico. The US has added fractionation capacity in anticipation of the new demand and neither BayStar nor ExxonMobil/SABIC is likely operating near capacity yet.
- Asian jet fuel market takes off after a long hiatus; airlines eye sustainable fuels
- Ahead of Expiry and Amid Solid Export Demand, December Natural Gas Futures Extend Gains
- Australia lays out plan to secure 20 more years of gas supply
- Cash Markets See-Saw, But Weekly Natural Gas Prices Find Path Higher Through Northeast
- China Gas, Vitol create JV to supply 5 mil mt/year LNG in five years
- China Petroleum signs 20-year contract to get LNG shipped from Louisiana; Braskem taps U.S. lawyers over former Pemex CEO’s testimony; Braskem-Idesa to expand ethane import capacity; Argentina’s Pampa Energia sales see 49% on-year increase
- China might do US a favor to open its crude reserves, but will prioritize its interests amid mixed interactions
- China, OPEC cool on U.S. bid to tame oil prices
- Crossroads, Encore Edition – Record Global Gas Prices Signal More Room for North American LNG
- Total Energy Monthly Data – November 2021 – US Energy Information Administration (EIA)
- Electricity Monthly Update – November 2021 – US Energy Information Administration (EIA)
- Electric Power Monthly – November 2021 – US Energy Information Administration (EIA)
- ExxonMobil and Chevron lag Permian independent production despite claims of leadership
- India to release 5m barrels of crude oil from strategic reserves
- Japan’s JERA will not renew 5.5 mil mt/year of long-term Qatari LNG supply: president
- Latest US Gulf offshore lease auction yields largest amount of high bids since 2019
- Oil prices slide on concern about new COVID variant
- IEA chief criticizes ‘artificial tightness’ in energy markets, says some failed to help cool prices
- North Dakota Gains Lift Latest Baker Count as Oil Activity Climbs
- Oil price spikes driven by ‘artificial tightness’, spare capacity underutilised – IEA
- Opec’s ECB mulls 66mn bl SPR release in Jan-Feb
- Petrobras boosts capex, trims asset sales outlook
- Petrobras to invest $68 bil in 2022-2026 as it boosts spending
- Poor regulation, not price cap, to blame for energy market mayhem
- Russia becomes world’s biggest oil producer in September, says statistics service
- Russia’s Lukoil sees oil output at pre-crisis level in 2023, reports profit jump
- Tokyo Gas confident of winter LNG procurement despite Malaysian supply uncertainty: CEO
- US E&Ps Said on Verge of ‘Energy Super Cycle’ Heading into New Year
- US natural gas production nears prepandemic highs in fourth-quarter drive
- US senator questions oil and gas companies on rising LNG exports, gas prices
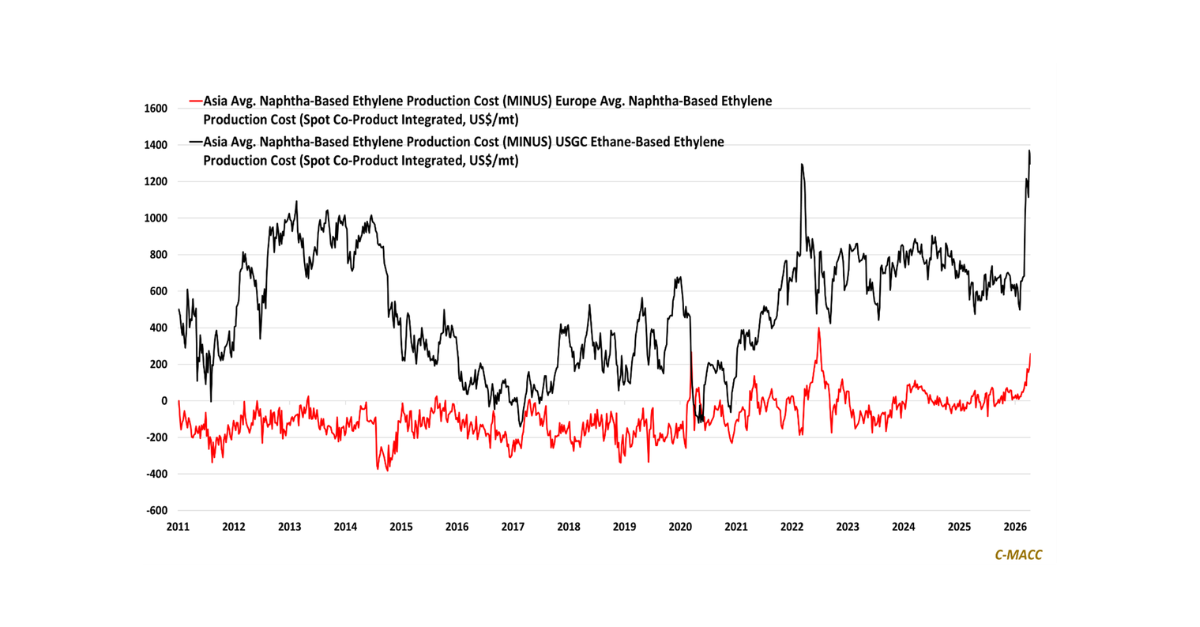
Exhibit #2: Brent Crude values fell relative to US Natural gas this week, while Ex-US naphtha values showed relative support compared to USGC ethane on average. The global petrochemical cost curve remains flatter at the feedstock level – a negative for US producers relative to Asia – when compared to its steepest levels in 2021.

Source: Bloomberg, C-MACC Analysis, November 2021
Exhibit #3: USGC ethane values on an MMBtu basis have trended lower relative to US natural gas since October, despite both at lower levels relative QTD. We model US ethane price support near term amid rising demand.

Source: Bloomberg, C-MACC Analysis, November 2021
Supply Chain, Commodity Chemicals, & Chemical Sector News:
There is not much to discuss today, especially as the movements in energy today and the emerging risk of further travel restrictions and lockdowns could drive swings in commodity chemical prices, and the stability of this week could be old news quite quickly. The refining rates could swing back down for example if there are further international travel restrictions and jet fuel demand slips again. This would be negative for propylene and benzene supply.
- Borouge announces new PP and PE grades
- Brazilian group sees 2021 windfall from US plastic resin sales
- China’s October Li2CO3 imports, LiOH exports rise. Argus notes “China’s lithium carbonate imports and lithium hydroxide exports grew in October YoY, in response to robust demand from the lithium-ion battery industry.”
- Cumberland Plastics invests $5.7M in Alabama expansion | Plastics News
- EU opens in-depth probe into Greiner’s acquisition of Recticel
- EV demand leads Lanxess to boost compounding in China
- Hindustan Organic Chemicals extends closure of phenol plant
- Methanol’s growing traction as alternative shipping fuel
- Methanex news for November and we highlight its latest December contract posting in the US of US$1.93/gal, which compares to a US$2.08/gal November contract, and a US$1.45/gal level to start the year. See LINK. See methanol margin trend estimates in our global weekly chemical update in LINK. Major US methanol producers include Methanex, Natgasoline, SCC, Mitsui Chemicals, Celanese, and LyondellBasell.
- Polypropylene (PP) prices drift lower in Asia – we continue to see this development as a negative for US PP price support and concerning for US producers, such as LyondellBasell, Braskem, and Pinnacle Polymers, among others.
- PTT invests in Thailand port expansion with construction starting in 2023
- Supply-Chain Woes Snarl Attempts to Tame House Prices. This report notes “Rising costs of construction materials, labor shortages complicate efforts to cool some of the world’s hottest property markets.”
- Tessenderlo raises full-year earnings outlook
- Westlake Chemical to acquire Hexion’s epoxy business for $1.2bn
Exhibit #4: US average refinery operating rates rose WoW, the fifth consecutive uptick but usage rates remain below 2019 levels for the time of year. US refineries, per our view, produce ~45% of US propylene and ~60% of US benzene. US regular gas price remain near 2021 highs and inventory levels sit near the low end of the five-year range – both favor upped refinery runs near-term, suggesting increased refinery chemical production into year-end 2021 (see LINK).

Source: EIA, Bloomberg, C-MACC Analysis, November 2021
Exhibit #5: US spot polymer-grade propylene (PGP), US spot benzene and US spot ethylene values show support WoW amid still strong derivative production. We anticipate US production rates to remain elevated into 2022.

Source: Bloomberg, C-MACC Analysis, November 2021
Exhibit #6: We highlight contract North American Methanol price trends relative to US spot levels to show that the December posting reflects an upward trend on a relative basis to spot values when compared to mid-year 2021 levels.

Source: Methanex, SCC, Bloomberg, C-MACC Analysis, November 2021
Sustainability, Clean Energy, Recycling & ESG:
We note the IEA work on CCUS in several charts below and this is good timing relative to our ESG and climate report this week – which focused on carbon pricing, something we believe is necessary to promote more real activity in CCUS. In Exhibit 7, it is important to note how many projects are in “development” rather than operational or under construction. It is also worth noting that the number of projects under construction has not grown since 2019. One of the reasons for this is that increased activity at the planning stage is then followed by a delay associated with permitting, which depending on the region can take 2 plus years. The other constraint is uncertainty, with many of the projects under consideration waiting for something to change, either local values of CO2 or mandates or direct government support. For example, the large project planned for Houston and championed by several oil, power, and chemical companies is unlikely to move forward without a higher tax credit for CO2 sequestration or without some other incentive. The mid-West projects targeting the ethanol industry will also need permits, not just for the wells but also for the many hundreds of miles of proposed pipelines.
The other important factor – which is partly shown in Exhibit 9 – is that much of the CCS we are seeing announced is around greenfield investment. This is partly because in some regions it is likely going to be challenging to get any carbon-intense growth project approved without a carbon plan, but it is also a function of how much less expensive it is to capture carbon if the facility is designed for it rather than a refit. While these investments may be important for growth and have some eventual linkage to overall carbon reduction – for example, blue hydrogen to blue ammonia to Japan to offset coal usage – they generally do nothing to lower the carbon footprint of existing facilities. The Dow Canada project is an interesting test case as the overall investment will eventually lower the carbon footprint of existing facilities. However, it should be noted that the carbon incentive in Canada is higher than in many regions.
Separately, the jump in the European carbon value over the last few days likely reflects a better understanding in Europe of how much heavier feed power capacity is going to be needed through the winter. As we have pointed out in recent research, faced with paying more for a carbon credit of buying LNG at $30+ per MMBTU, any utility with flexibility will choose to burn coal and buy the credit. The positive outcome will be to elevate carbon prices to levels that justify abatement investment without additional subsidies – see our ESG and Climate weekly – linked above.
- A Global Carbon Price Is a Mirage – WSJ
- A scalable and sustainable proposal with hydrogen as fuel to meet IMO2050 targets
- American Chemistry Council supports global agreement to eliminate plastic waste
- Asahi Kasei to make sustainable rubber for tires in Singapore
- Asahi Kasei hydrogen generator to slash costs
- Australian green hydrogen gets boost from new law
- BASF to form renewable energy subsidiary
- Benchmark EU carbon price hits fresh record over 75 euros/T
- BOJ says 43 lenders qualified to tap its climate loan scheme
- Braskem and Cosan create partnership to leverage circular economy and carbon neutrality
- Carbon decouples from gas market dynamics
- China’s 2022 Wind Power Growth to Stay Strong Despite Subsidy End
- China plans methane emission controls in key industries
- Commission adopts new annexes to EU Emission Trading System State aid Guidelines, defining applicable efficiency benchmarks and CO2 factors
- Company valuations and climate strategies are poles apart
- Consortium picks electrolyzer partner, accelerates schedule for green ammonia project in Egypt
- Don’t take corporate net zero pledges at face value
- The fight to dismantle the little-known Energy Charter Treaty
- EU Carbon Rises to Record as Germany Mulls Floor Price
- Europe carbon price hits new record
- European renewable hydrogen producers call for transition period on additionality
- Enel CEO skeptical of carbon capture and storage technology
- G7, G20 to push international climate ambition
- German car goals not tough enough to protect climate, NGOs say
- Germany’s energy plan to have limited impact on EU carbon prices, analysts say
- Germany to pump more than 50 bln euros into climate fund – sources
- Grupo Antolin develops the first car headliner substrate made from plastic waste and used tires
- Household plastics recycling collections during pandemic reached 41%
- Hydrogen projects face funding gap in Europe: banks
- Ineos Styrolution to build pilot PS chemical recycling plant in UK
- INTERVIEW: Hydrogen is ‘massive’ market opportunity for BP
- Leading the way to green development
- Linde and KazMunayGas in Clean Energy Pact
- NIO, Shell collaborate on battery swapping and charging
- Nusaned investment™ enters deal for new plastic recycling plant in Rabigh
- Policy makers must accelerate hydrogen rollout to meet net-zero goals: IEA
- Raising carbon prices – Europe’s preferred tool for meeting its climate goals
- Russia needs to invest up to $54 bln a year to reduce carbon footprint – cenbank
- South Korea to provide 27.9 mil mt/year of ‘clean hydrogen’ by 2050
- The urgent case for stronger climate targets for international shipping
- Tire producers work on finding more uses for nearly a billion units discarded annually after end of road wear
- Tokyo Gas to spend Y2 trln on clean energy to double profit by 2030
- Unifi Reaches Key Sustainability Milestone Ahead of Schedule
- Wartsila aims to eliminate the hydrogen storage challenge
- What is plastics’ traceability in the recycling process?
- With sponges and petitions, climate activists take on insurers
- Separate Ways (Worlds Apart) – Journey To Decarbonization A Tricky Path For Crude Oil, Natural Gas, NGLs
- Carbon capture in 2021: Off and running or another false start? – Analysis – IEA. Within this IEA research report, it is noted that “This year has seen unprecedented advances for carbon capture, utilization, and storage (CCUS) technologies – and there are encouraging signs that this time the momentum will deliver tangible results that can help tackle global emissions. So far in 2021, more than 100 new CCUS facilities have been announced and the global project pipeline for CO2capture capacity is on track to quadruple.”
Exhibit #7: Global pipeline of commercial CCUS facilities operating and in development, 2010-2021Source: Carbon capture in 2021: Off and running or another false start? – Analysis – IEA, November 2021

Exhibit #8: Global CCUS projects in development by region or country, 2021

Source: Carbon capture in 2021: Off and running or another false start? – Analysis – IEA, November 2021
Exhibit #9: Global CCUS projects in development by application, 2021

Source: Carbon capture in 2021: Off and running or another false start? – Analysis – IEA, November 2021
Exhibit #10: EU carbon dioxide (CO2) values took another step higher WoW to hit a record level, closing the week 19% higher since the start of 4Q and 118% higher YTD. Energy cost inflation in 2021, as illustrated by our discussion of global natural gas prices in our recent research, and also a movement to more coal-based power has been a major driver of higher EU CO2 values. We discuss this development and other industry trends in this report.

Source: Bloomberg, C-MACC Analysis, November 2021
Other Chemical Industry, Demand & Downstream News:
The headline on China Direct Foreign Investment is timely as investing in China is the core theme of our upcoming Sunday piece this week. We are seeing many western chemical companies up their investment in China this year, all chasing a return to domestic demand growth that has been negatively impacted by COVID, as well as some logistic constraints in the export market. A fresh COVID wave will quickly extinguish some of the more enthusiastic headlines below and may give those investing in China some sleepless nights through 2022 as the money gets spent, but we would expect the underlying domestic demand growth in China to pick back up again eventually. The risk for all investors in China is exactly what we have seen this year, which is that too many people chase the same growth expectation and the country ends up in surplus and forced into the export market but without any underlying feedstock advantage. In the Sunday piece, we will also discuss geopolitical risk.
- Amazon’s Black Friday greeted by climate activists, strikes in Europe
- Black Friday Shopping Is Back, but the Doorbusters Aren’t – WSJ
- China: Foreign trade to see focus on opening-up
- China urges more banking support to self-reliant industries, supply chains
- China’s robust economy to attract more foreign investment, talents, economist says
- China, Russia to further boost trade with more agriculture, energy deals expected
- China to boost quality development of foreign trade
- Crowds expected back at stores over Thanksgiving weekend
- Dry Bulk Carriers Still In Demand Despite Recent Market Downside
- ECB must keep options open beyond Dec amid uncertainty: accounts
- EU adds more pieces to its ‘elusive’ capital market jigsaw
- EU sees ‘decisive moment’ for building single capital market
- Europe stocks, crude down sharply as new coronavirus variant sparks travel bans
- Europe’s big payday remains elusive even as inflation surges
- Eurozone to support economy in 2022, use EU funds for investment
- Fed to kick off faster tapering plan from January – Goldman Sachs
- German banks vulnerable to housing bubble; should build buffers: Bundesbank
- German business morale darkens on supply bottlenecks, COVID
- Global deal activity down by 5.7% in October 2021, finds GlobalData
- Global supply chain hit by disappearing ships in Chinese waters: Report
- Japan factory activity grows at fastest pace in nearly four years
- Japan raises view on consumption, downgrades exports in Nov report
- New Covid-19 variant sparks travel restrictions
- Not since Americans came home from World War II has inflation run through the economy like it is now
- On the Front Lines of the Supply-Chain Crisis – WSJ
- One-size-fits-all not right approach for economy
- Sticker shock could change retailers’ approach to sales
- Tesla to expand capacity at China plant
- The Belt and Road Initiative: A true win-win situation or a double win for China?
- What are good travel gifts? Experiences travelers can book themselves
- UK factory orders growth hits record, inflation climbs too
- UK retailers report strong pre-Xmas demand, biggest price rises since 1990
- US Durable Goods Orders Fell 0.5% in October
- US restricts trade with a dozen more Chinese technology firms
- Holiday shopping 2021: Williams-Sonoma to ride holiday entertaining trend
- With Fed’s Powell renominated, focus turns to speed of bond-buying taper
- Yen, franc surge as new virus variant rattles markets
Exhibit #11: Total US rail traffic rose modestly WoW and, posted below 2019 levels. We also highlight Chemical rail traffic (Ex. #1) and North American rail traffic trends by-product (Ex. #12).

Source: AAR, Bloomberg, C-MACC Analysis, November 2021
Exhibit #12: North American rail volume decreased WoW, but we highlight above-average strength in chemicals and still notable weakness in Motor Vehicle & Parts traffic. See the full November AAR update in LINK.

Source: AAR November 24 update, November 2021
 Loading…
Client Login
Learn About Our Subscriptions and Request a Trial
Contact us at cmaccinsights@c-macc.com to gain full access and experience our services!