C- MACC Sunday Thematic & Weekly Recap 185
Suspension of Disbelief: Maybe CMA Will Rattle Some Cages
- Yes, it can get worse! While the US and the Middle East sit on a considerable feedstock advantage, as they push more exports, everyone else will suffer.
- The idea that China has a quick fix to improve the very poor state of the economy is fading fast – so there will likely be only negative effects from China in 2024.
- That chemical industry profits can grow globally in 2024 is a pipe dream in our view – relative feedstock moves that help North America, hurt Europe and Asia.
- Adding to the problem, feedstock surpluses are rising and for some, integrated economics will dictate higher chemical operating rates and fewer closures.
- Otherwise, we look forward to our hydrogen debate – but hydrogen, like other energy transition initiatives, has cost issues that play to China’s advantage
Last week we discussed 23 Chemicals and Related Products and 102 Companies.
See PDF below for all charts, tables and diagrams
Exhibit 1 is a simple chart, but it shows the lack of critical thinking on the sell side these days – while every new piece of economic news suggests that 2024 could be a real challenge, not one chemical company on the list below has a down estimate of earnings for 2024 vs 2023. This is despite many companies having a good start to 2023. We blame this on a couple of things. First the unprecedented nature of the global supply overhang that the industry faces today – especially for polyolefins – means that no one has a proxy to help model. Second, in a sell-side model that now depends on corporate access to get paid, being positive makes your life easier. We suspect that at its conference this week, CMA will present some medium-term operating rate scenarios that will grab some attention, and our sense is that the corporates are more worried than the investors – except in a couple of cases – see Exhibit 2. A coincident investor conference for chemicals next week may drive some of these estimates lower, but only if we see some regulatory-based releases first.
Exhibit 1: Consensus is basing its estimates on too much hope and too little analysis

Source: CapitalIQ, C-MACC Analysis, September 2023
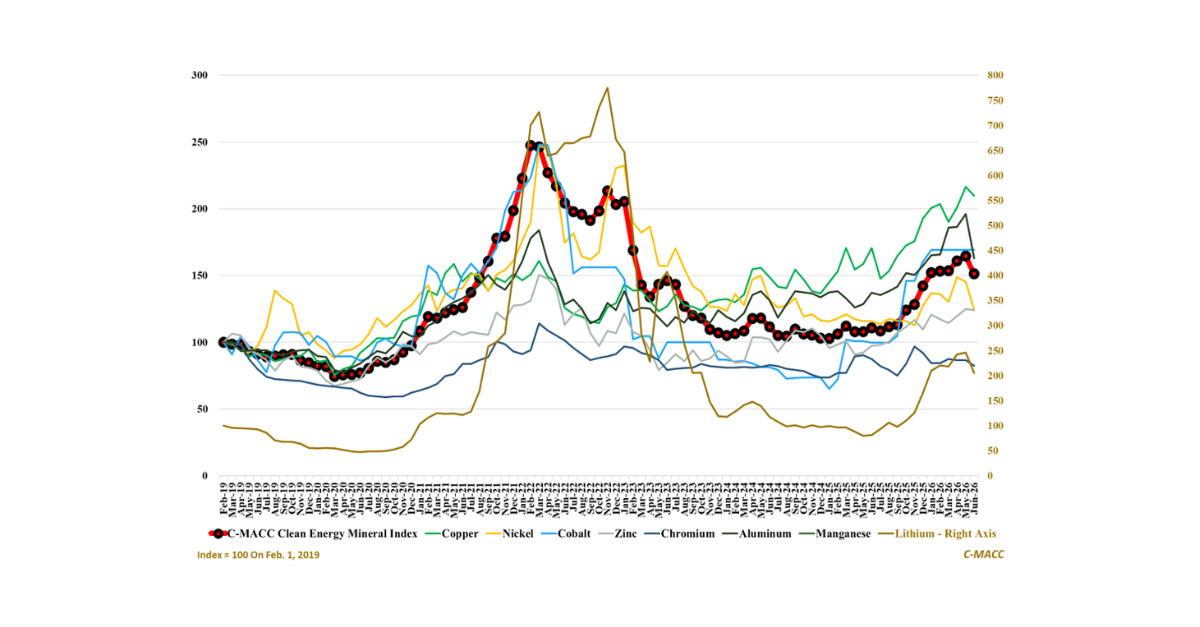
Our supply-demand models for olefins and polyolefins do not have the years of consistent history that CMA has – although they are quite good – but the rearview mirror is irrelevant, our forward models are robust, and we cannot see a rosy picture next year or the year after. Moving operating rates from 75% to 78% for example will not make any difference to the mood of the market or the overhang in supply. We again bring up our favorite anecdote from the early to mid-80s, which is that while operating rates improved steadily from the early 80s and created a peak in profits from 1987 through 1990, the worst margin/profitability year for the industry was the last one of the trough – 1986 – not the first. As the reality set in that there was not going to be a quick fix to the problem, market share battles intensified with those sitting on a cost advantage looking to squeeze others to shut down. Exhibit 2 shows our commodity index components. Our diversified group is down around 4% year to date.
Exhibit 2: Stock performance has been much more mixed for commodities and may be a reflection of feedstock exposure

Source: CapitalIQ, C-MACC Analysis, September 2023
Our lack of optimism is based on a handful of key factors – several of which we have covered in the past and one of which we will cover in more detail below:
- China is still building new capacity – as is the US – but China is unlikely to slow down in terms of production quickly, despite local oversupply and high costs.
- We have covered at length some of the political reasons to keep producing and some of the cost implications of access to discounted Russian crude and condensate.
- The more obvious shutdown candidates today – outside China – are in Europe and in other parts of Asia – the Shell Singapore story is a good example.
- In some of these locations, shutdown decisions are challenged by integration issues, labor-related challenges, and national security concerns.
- We would expect it to take years to get some decisions finally enacted – although the LyondellBasell polypropylene decision for Italy is a good, but small, first step.
- Weaker Economic Projections – They Keep Coming
- In the headline in the chart below we suspect that Goldman is mixing a view of OPEC production cuts with a glass-half-full view of economic growth. Having worked for a couple of global investment banks we know that it is better for business to be incrementally more positive about the economy than incrementally more negative – you get more from hopeful clients than depressed ones. We would stick with our consistent message, and we are more focused on what OPEC cuts are telling us about their economic expectations than we are on what Goldman’s economic forecast is telling them about oil prices.
Exhibit 3: We highlight recent movements in Brent Crude and US, NW Europe, and Asia natural gas prices. We also highlight the article, Goldman Claims Oil Prices Could Hit $107 If OPEC+ Extends Cuts Next Year.

Source: Bloomberg, C-MACC Analysis, September 2023
- But the big one could be feedstock oversupply.
We are building a vast amount of infrastructure on the US Gulf Coast on the basis that demand for US crude oil, natural gas, and NGLS will continue to grow, as suggested in the NGL chart below. The thesis is sound for LNG, mostly sound for crude oil, but a lot more circumspect for NGLs. Where will the demand for more NGLs come from in a depressed chemicals market unless the US becomes much more aggressive in its ethylene and propylene and derivative production and exports? Alternatively, the market could get much more aggressive in the construction of ethane and propane export capacity and encourage others outside the US to convert ethylene capacity to lighter feeds. INEOS is doing this already and trying to do more, but its construction plans in Europe are blocked, Borealis is moving ethane to Europe and others are moving ethane to Mexico and Brazil. Unless we can find a home for the ethane and propane either domestically or in export markets, we run the risk that both streams become even more surplus in the US and generate pricing that suggests the US will flood the global markets with low-cost chemicals less discriminately than they are doing today.
The ExxonMobil forecast that we discussed in the Sustainability report a week ago – The ExxonMobil 2050 View Exposes Flaws in The Renewable Plan – would suggest that US NGLs will remain in significant surplus, and if the company truly believes this then another ethylene project is possible. That said, more ethane and propane surpluses in the US market might persuade the midstream companies to make ethylene, which they can likely do without compromising their MLP status. If oil demand falls, we have the opposite effect which would be a decline in US NGL supplies and possibly a change in the shape of the global ethylene cost curve. This is not something that should impact the next 10 years.
Exhibit 4: Permian Basin Production Growth Drives NGL Pipeline Build-Out

Source: RBN Energy, August 2023
Exhibit 5: USGC NGL gross fractionation margins have increased from YTD lows but remain notably lower than 2022. The negative trend to this chart is relevant.

Source: Bloomberg, C-MACC Analysis, September 2023
Rising oil prices throw a lifeline to the natural gas-based industries in the US and the Middle East, but only benefit the large LNG importers if LNG prices are set by export economics rather than oil equivalent values. The other industries that could see some benefit from higher oil would be some of the renewable fuels and materials initiatives as oil rises relative to alternative feedstocks such as waste oils and crops. But the other challenge is the growing surplus of naphtha, especially in Asia but also in Europe. In the second chart below, we show the average ratio over the long term, but the trend is negative, as it is for European naphtha versus Brent and US ethane and propane versus natural gas. These trends signal too much material in the markets and encourage more olefin production. In Exhibit 8 we show ethylene margins by region and the US appears to be the only one with a positive number today. Europe is more upstream integrated than the US and more downstream integrated than the US and this is likely keeping facilities running, either because they are part of a refining optimization, because there is a positive downstream margin, or both. Asia is a much more mixed bag.
Exhibit 6: Oil hits $90 for first time in 2023 as Saudi Arabia and Russia extend cuts

Source: Bloomberg, C-MACC Analysis, September 2023
Exhibit 7: Singapore Naphtha remains below its five-year average price compared to Brent Crude.

Source: Bloomberg, C-MACC Analysis, September 2023
We talked last week about the improved rail volumes in the US for chemicals likely driving higher exports of ethylene derivatives – particularly polyethylene. The ethylene margin chart below clearly indicates why this should be happening, as the US can afford to put polyethylene in any naphtha-based markets at prices below local costs. Increased US exports are pushing into markets where demand growth is anemic, and consequently, they will only find a place if they displace local production. Markets in Asia are growing, some more quickly than others, but the polymer overhang is so sizable that neither North America nor the Middle East can move more polymers into the region without cutbacks in local production. We have generally interpreted the rail data below as positive, but if some or all of this is simply the US flexing its cost muscles and pushing more volumes to the ports, then the US gains simply add more pressure to an oversupplied rest of the World. We discuss the closure of the LyondellBasell polypropylene unit in Italy below, but the pressure is also on polyethylene in both Europe and Asia. Rising costs are an argument buyers will listen to up to a point, but the effect is more limited in an oversupplied and competitive market. For perspective, the new Shell facility in PA should generate around 1000-1100 cars of polymer per month at standard operating rates – BayStar around half of that.
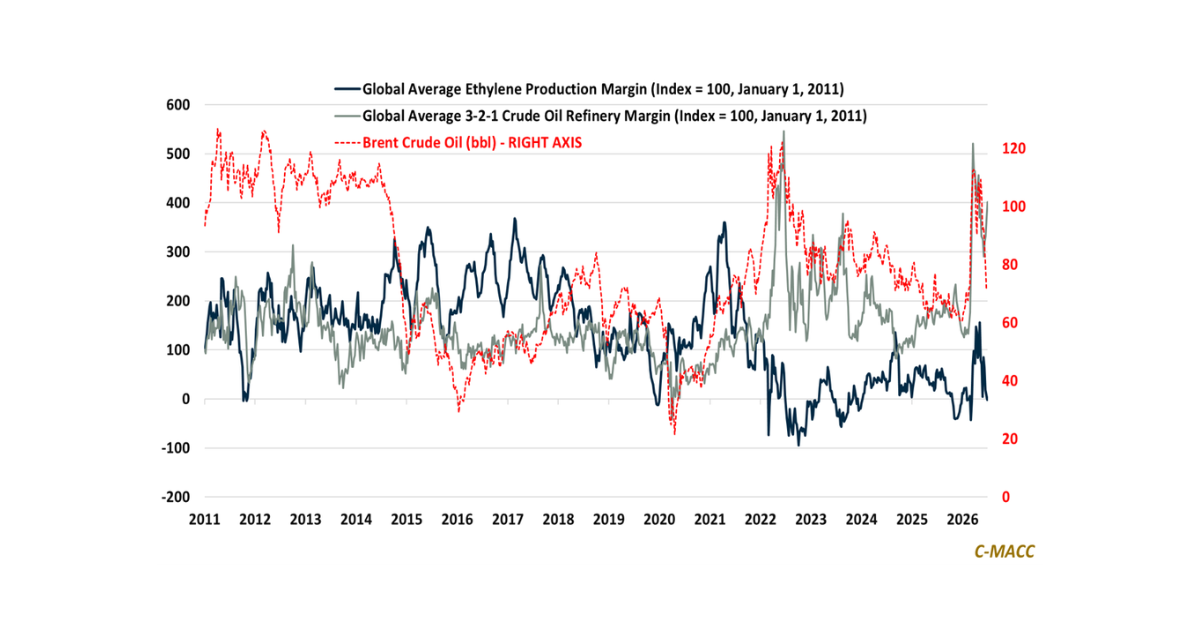
Exhibit 8: Global ethylene production margins in major regions display the US ethane advantage, and we note that Europe and Asia’s margins are negative despite feedstock relief from Ex-US naphtha prices trending lower relative to Brent Crude values.

Source: Bloomberg, C-MACC Analysis, September 2023
Exhibit 9: US chemical rail traffic increased last week, which we partly link to chemical price (and margin) improvement spurring production in early-to-mid 3Q23.

Source: Bloomberg, C-MACC Analysis, September 2023
We have seen some headlines about rising prices for chemicals over the last few weeks and we may see some attempts at positive spin on this at both the CMA conference and the investors conference that is happening at the same time. However, if you look at the chart below, it is all being driven by the rise in crude oil prices and price increases are attempts to make margins less negative in Asia and Europe as the data in Exhibit 8 above implies.
Exhibit 10: Global polyethylene prices have increased relative to 2019 (pre-COVID) levels but have not increased at the same rate as overseas upstream costs, which have risen with Brent Crude. As implied by the chart below, the US natural gas cost advantage has improved since 2019

Source: Bloomberg, C-MACC Analysis, September 2023
Otherwise, Last Week – More on propylene and Ag
And so, it begins. The polypropylene market was in trouble before the polyethylene market because of overbuilding in China and new capacities in North America. Over the last four years, North America and China have swung to surpluses, which has had a very challenging effect on the rest of the world. LyondellBasell was particularly exposed to the Italy facility because it has no direct propylene integration. We see this as the first of many likely polyolefins’ closures over the next couple of years and have covered this at length in our work this year. For now, we see the most pain in Europe and Asia but expect the Asia closures to be in countries outside China for the most part. Note the Chinese polypropylene export headline below – this would devastate the global business in a slow-growth world, and meanwhile, China keeps building.
The charts below suggest that the global polypropylene and propylene markets are a mess. Even if LyondellBasell could swap its own propylene into Brindisi, it would be doing so from an ethylene facility already running at a loss. Physically shipping the propylene would add even more cost. There is a relatively high-cost ethylene unit at Brindisi, and we suspect that the closure of the polypropylene unit could also be the end for this facility. It is unclear how hard the facility in Brindisi was operating, but the shutdown would suggest that the future of the whole complex looks fairly bleak, and Italy stands out as a high-cost location to make chemicals in the current environment unless Eni sees chemicals as a means to consume surplus hydrocarbons.

Source: Bloomberg, C-MACC Analysis, September 2023

Source: Bloomberg, C-MACC Analysis, September 2023
As we have noted in recent research, we see the agriculture sector and all associated industries as primed for a recovery and looking much more interesting from an investment perspective than many other groups that we follow. Crop prices have weakened but remain high historically, and we are now beginning to see some supply concerns and a turn in corn pricing. Ammonia prices are also bouncing off the bottom. We may see incremental demand for ammonia as a shipping fuel and power station fuel before any of the proposed blue ammonia investments for all the regulatory and cost-related delays we discussed above.
Exhibit 13: We highlight crop price trends to consider with the exhibit following this one. Similar to food prices, crop values reflect early 2021 levels. However, they are still significantly higher than in 2019 – a plus for farmers but not for consumers.

Source: Bloomberg, C-MACC Analysis, September 2023
Exhibit 14: World food price index back at two-year low despite rice surge, Food and Agriculture Organization says

Source: Bloomberg, C-MACC Analysis, September 2023
Hydrogen Economy – Pushing The (Clean) Boat Out – The Largest Need for Hydrogen
While the FT is not on our distribution list, our message appears to be getting through. Two weeks ago, we wrote about how to manage an insufficient supply of hydrogen and concluded that it would be challenging and would involve using other things that we do not have enough of, such as crops or electric power. The FT’s take is that shipping and jet fuel should take priority over other hydrogen applications because there is not enough to go around and because these are the uses with the least options – we repeat the first exhibit from our report two weeks ago below (Exhibit 15). When we ask Tim Cesarek at the CMA meeting next week whether Gevo can make its net-zero SAF without clean hydrogen, we are sure that his answer will be no. But in the Gevo process, most of the hydrogen in the fuel is coming from corn (via ethanol) and not from an electrolyzer. If you take the FT synthetic fuel view, then all the hydrogen is coming from an electrolyzer. It is important to note that all biofuels – from corn, waste oil, soy, canola, gasification of waste, or gasification of biomass, are all looking for the hydrogen molecule. This is the holy grail of clean energy and companies are looking at processing 100 tons of feedstock to get 5 tons of hydrogen. With water electrolysis, you are processing 10 tons of feedstock to get 1 ton of hydrogen. It is right to think of the hydrogen molecule as precious and consequently right to think about prioritizing its use. The second headline below shows exactly what we should not be doing with what could be a scarce resource. Interestingly, if you are in the metals industry a yield of 5-10% is something you dream of, as in many cases nickel and copper deposits have concentrations of less than 1% in the material that is mined and require substantial processing to get to the metal.
- Why are we wasting our limited supply of green hydrogen?
- FIA and Extreme E set out to establish hydrogen off-road racing world championship
Exhibit 15: The turn in Ammonia prices is a good sign, but prices need to move much higher to justify green ammonia investments, even with the 45V incentive in the US.

Source: Bloomberg and C-MACC Analysis
In the chart below, the only use that eclipses shipping as a need for hydrogen is its use in the chemical and refining processes that constitute its main use today – were there cheaper alternatives they would have been found by now. A lot of this is already for ammonia and methanol, just not for use as a shipping fuel, yet. But there are now plenty of ships under construction that are designed to run on methanol and a few that are being built to run on ammonia. As we noted last week the density of ammonia as a fuel for shipping is marginally better than methanol (see chart below, which we include again), methanol does emit CO2 and would have to be manufactured by capturing CO2 in the process to be considered clean or net-zero. Some are talking about methanol from renewable natural gas (RNG), but we see this as a very limited market as the potential demand for RNG is likely to surpass supply by a wide margin, making it expensive. We need some clean hydrogen to upgrade fuels made from carbohydrates, such as corn, sugar, and soy, but we need a lot more to make the ammonia and methanol that we need.
Exhibit 16: Cutting back requires expensive alternatives.

Source: Corporate Reports and C-MACC Analysis
Exhibit 17: Ammonia is closer to the energy density of diesel than methanol.

Source: Science Direct 2018
The density piece of the puzzle is important, as there is a weight compromise with any carbon-free fuel. Shipping would have the same issue as trucks using hydrogen but on a much larger scale. The weight of the compressed hydrogen tanks is very high, as would any cryogenic containment system, together with the required liquefaction equipment before use. Where we are seeing experiments with hydrogen in shipping, it is hub and spoke, so the ships come home to refuel and the duty on the vessel is not high enough for the containment weight of the compressed hydrogen to interfere with the function of the vessel. The high end of the forecast range for ammonia used as a shipping fuel assumes that all shipping moves to ammonia by 2050 and calls for a billion tons of ammonia per year. This is roughly 3x the current fuel oil market in tons and is explained by the lower energy density of ammonia. We have noted in prior work that there will be extreme challenges with meeting this demand, without adding demand for power stations in Asia and demand for ammonia as a hydrogen carrier. At 2.0 million tons a year (5500 tons per day) – which would be a challenge today – we would need 500 new facilities – each consuming 40-45 GW of power if all was green. That is 18 facilities a year consuming 830 GW of new renewable power per year.
Exhibit 18: IRENA analysis of the range of possible demand scenarios for ammonia – not the high case for shipping which essentially reflects the entire shipping market.

Source: IRENA
The IRENA analysis (above) is a year old now but looked at varying forecasts for possible ammonia demand. The very wide range for shipping reflects several different estimates of how much of the shipping market will move to ammonia, given the string push for renewable or e-methanol and a push for direct hydrogen. There are also those suggesting that wind power could make a comeback for shipping and some prototype container vessels are in the works. The lure of ammonia is that it has no CO2 footprint, but it does produce oxides of nitrogen when burned and these would need to be captured in the same way they are from other exhaust systems. This means more DEF, more Urea, more clean hydrogen!
Exhibit 19: Yara’s forecast was meant to be bullish in our view as it is in part to support the separation of a clean ammonia sub. Its estimates are dwarfed by the IRENA numbers in Exhibit 4.

Source: Yara
Exhibit 20: IRENA took selected points by end-use from Exhibit 17 and created a bullish ammonia forecast.

Source: IRENA
Regardless of which colors of hydrogen going forward you believe will be most important (all but grey and brown in our view), it is quite easy to get excited about potential demand. The estimates for shipping fuel range dramatically depending on who you talk to, and IRENA has done a good job of putting the forecasts into context – see Exhibit 17. Both IRENA and Yara released forecasts of expected ammonia demand, through 2050. IRENA because the agency considers it its role, and Yara because at the time it was making a case for spinning out its clean ammonia business. Surprisingly, IRENA is more bullish than Yara, and both estimates are shown in Exhibits 18 and 19. On a hydrogen basis – however, you make the ammonia – we need between 55 and 90 million tons of new hydrogen capacity between now and 2050. This is just for ammonia.
If clean methanol takes off as an acceptable marine fuel, then the ammonia projections in the charts above will be too high, but the implications for hydrogen will not change much. It will be necessary to capture carbon to make clean methanol so that you can claim that no more was emitted when burned than was collected to make it. That said, ammonia should always have a clean edge as there is no CO2 emission. Ammonia combustion will require NOX cleanup and will increase demand for DEF-like materials – good for the Urea market – which will also need more hydrogen!!
Sustainability and Energy Transition: How do we fund low-return projects with falling cash flows
As we head towards a week of conferences in the US, one of which we are participating in directly, we expect the focus to be largely on two buckets – what happened to our profits, and how do we pay for decarbonization? This is a very different world for the chemical industry than it was 6 months ago, and while the stock market is still suggesting a relatively quick rebound, this time we think it’s wrong. In our Sunday Piece, we will focus on the industry fundamentals, and in this piece, we will make some suggestions around how the industry makes progress on the sustainability and transition front given both mounting uncertainties and rapidly mounting costs – both this report and the Sunday report will be free to read on our website. On the sustainability front, the mood is changing both at the government level and at the corporate level from “what can we achieve” to “what can we afford” and it is interesting to see the new EU climate minister (nominee), Wopke Hoekstra, prioritizing the CCS debate in Europe. Blue hydrogen is a lot cheaper than green hydrogen with the right CCS incentives and natural gas is far more abundant than renewable power.
Exhibit 21: Green = Has Money – Yellow = Has Some Money – Red = Broke

Source: C-MACC Analysis, September 2023
In Exhibit 20 we have tried a three-dimensional plot by using colors to signify how much money the chemical industry has available to spend. Some of the positioning on the chart is obvious, but we suspect that some may be surprised to see where we place the US. The regulatory challenges in the US are high, but in addition, they add to costs and create delays. Everyone looking for permits today is struggling and it is a major point of contention in Washington, with a large bipartisan group trying to get support to reduce bureaucracy. The US has the money, and incentive structures to lower costs, but the other challenges are severe – less severe in Canada, and we may be treating Canada a little unfairly – although keep reading. The other one that needs a lot of qualification is China because the chemical industry is bleeding cash right now for the most part, but the government pressure is on to boost the green economy and consequently, there is a lot of investment in green hydrogen and carbon capture – such that China could emerge with a significant decarbonized industrial base far quicker than the rest of the world.
The UK is better off than the EU in our view because the bureaucracy is lower, and the subsidies for some things, especially carbon capture, are higher. At the European chemical company level, however, cash flows are collapsing, and companies are likely more focused on what to keep running than how to decarbonize what they keep at this point – although the debates are connected. Asia Ex-China is more complex as it is very different country by country and dependent on the integrated nature of the chemical industry – so how little money it is losing – as well as local decarbonizing options, like access to cheap power (hydro possibly) or ease of CCS (Malaysia). For the Middle East, it comes down to a country strategy and an energy strategy. The region can afford to pay to lower emissions, but the push will almost certainly be harder for CCS-based solutions than those that lower hydrocarbon demand.
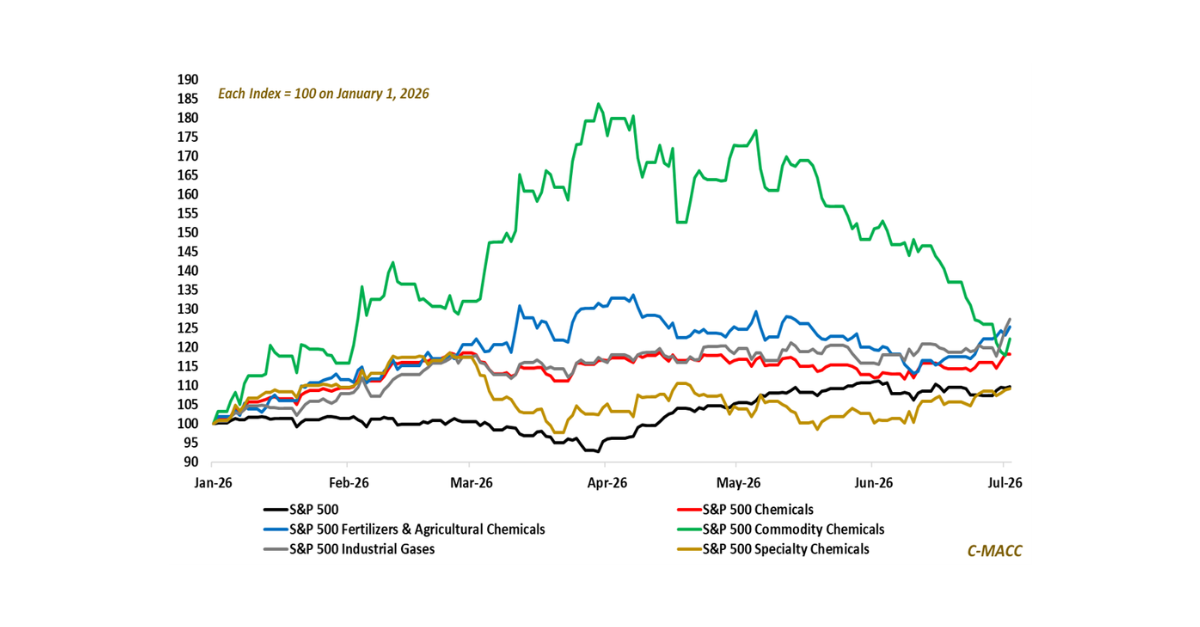
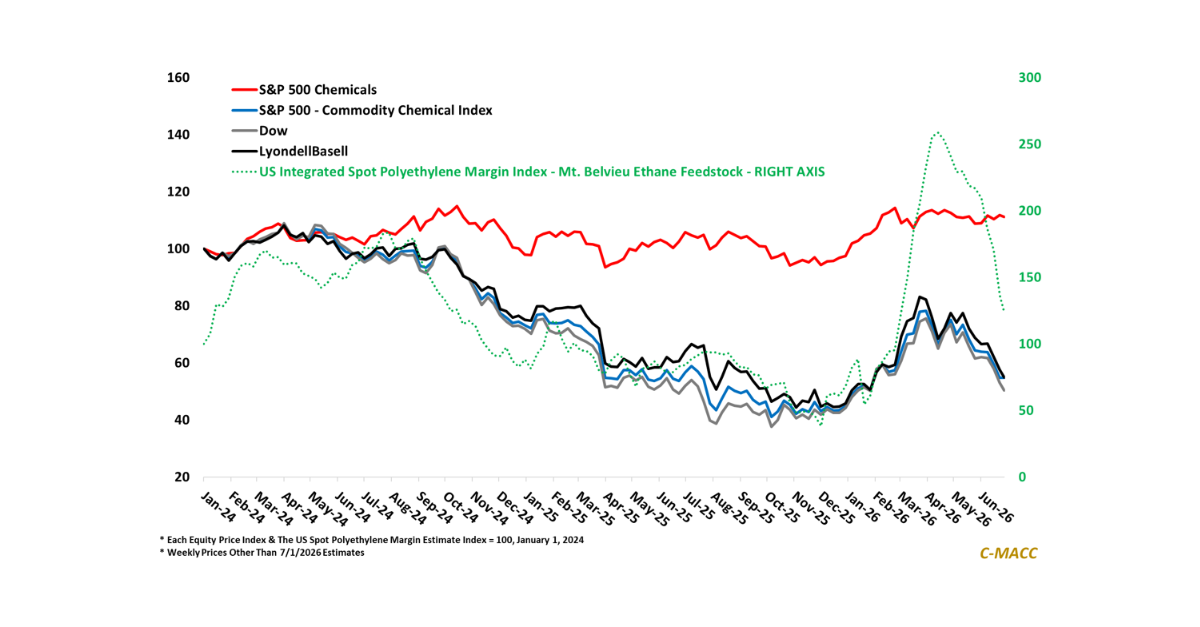
We show the stock chart below because it is interesting to see the commodity chemicals group trading well relative to the overall chemical index. We would expect the gap between Ag and commodities to close over the next few months as revisions worsen for commodities but in the meantime, higher values at the commodity companies may lead to some transactions that are focused on looking for synergies or integration, but also moves that might make per ton decarbonizing costs lower.
Exhibit 22: Commodity chemical equities are defying gravity a little in our view and it is partly because analysts still expect a quick rebound in profits in 2024 – maybe the conferences will be a catalyst to change this view.

Source: Bloomberg, C-MACC Analysis, September 2023
But ultimately it will all come down to the customer – what does the customer want in terms of more sustainable products and lower carbon intensity and what will they pay for it? While the rest of the C-MACC team will be at the CMA conference this coming week, Cooley is heading to Pack-Expo, and while part of this is focused on us trying to better understand a US polymer pricing market that looks increasingly opaque these days, the primary objective is to get a stronger feel for how the packagers really feel about sustainability and what if any, premium they are willing to pay for it. The other question in the polymer sector is what matters most, renewably sourced, low carbon footprint, recyclability, or low price. We suspect the customer wants everything and we see real challenges with delivering everything without a price implication. More on this after the conferences.
You will only see the smiling faces in the picture above one more time, but it is worth talking about the broader CMA conference agenda in addition to just our piece. The theme of sustainability runs through the agenda, but this is historically a platform that focused on supply/demand fundamentals and profitability forecasts, and consequently, it will be interesting to see in which way the discussions flow, because we have this perfect storm brewing of declining industry cash flows while decarbonization costs are increasing everywhere, but especially in the US. We were somewhat surprised by the rise in project costs that Origin Materials suggested in its quarterly update, but when you read stories like the one below, perhaps Origin is not in too bad a spot. The idea that power prices from offshore wind projects in the US might need to rise by 50% to get the industry back on track makes Origin’s challenges look far less troubling on a relative basis. We have seen Nutrien delay a possible blue ammonia project in the last few weeks with cost inflation one of the main drivers, and there are plenty of other examples of projects that are looking for far more financing today than was suggested when they were first discussed.

- New Report Reveals Costly Shift In Green Energy Landscape
- Four NY offshore projects ask for almost 50% price rise
Spoiler alert – one of the conclusions that will come from our panel next week is that this stuff is not free – so, someone must pay, or it all comes to a halt. The chemical industry knows what to do in a downturn – hunker down and conserve cash – not so good for consultants but also not so good for capital projects that do not have a financial return, and most decarbonization projects are what we have been referring to as empty capital – spending with no return. Some of the US tax incentive packages offset some of the emptiness, but as we noted above, cost escalation and regulatory purgatory add further project risks and costs. The other option is to take the Dow approach in Canada – combine a growth project with a low-carbon initiative. Today it is unclear whether the world will need that polyethylene.
Sticking with the subject of who pays for it, we would not want to be a taxpayer in Germany, but we suspect that what Germany is planning will spill over into the rest of Europe, suggesting that we would not want to be a taxpayer in Europe. The suggested power subsidy in Germany is expensive enough, but the Canada/Germany hydrogen corridor plans also look expensive – the landed price of hydrogen in Germany will be high and someone will have to pay for that. But Germany is not an island and other European companies will have to come up with ways to make clean power cheaper – France is already discussing “contract for difference” schemes in the same way that the UK is looking at CCS. The UK, by contrast, is an island, disconnected from the EU, and is an oil and gas producer. There is a distinct opportunity for the UK to use its advantages, some of which may be more limited than others, to drive a better outcome for the country than the rest of Europe – the biggest challenge in the UK is what appears to be weak leadership and a lack of labor.
Exhibit 23: Exclusive: Canada oil sands carbon capture project struggles to get the key contract. For a bit of background, Inside the Pathways Alliance, Canada’s oil sands pledge to reach net zero by 2050.

Source: LooktoCanada, September 2023
Risk remains another challenge to all projects and the carbon capture issues suggested in the diagram above for Canada is another great example of a government unwilling to step outside a comfort zone to get something done. All aspects of energy transition and decarbonizing investments involve risk, and we will get nowhere – as we are seeing in the US Gulf with CCS – if the regulatory agencies are not willing to take some element of risk with their approvals. None of the shipping needs for ammonia and methanol can be met without blue hydrogen and this needs CCS. The continued need for fossil fuels for longer than hoped is becoming more obvious every day, and so the need to lower the carbon footprint of these fuels is also urgent. We have governments in the West increasing incentive programs to try and move things forward while their regulatory agencies are looking for ways to stop progress rather than encourage it. Many of these regulatory bodies – the EPA would be a good example – are like oil tankers in that if you want to change direction or speed you must plan in advance and even then, the move takes time.
While we would expect a lot of questions both about sustainability in general and how it gets paid for at the CMA conference, we suspect that the answers will be vague. This is unlikely to be attempts to be deliberately evasive and more likely to be a function of just not knowing. If you are attending, we look forward to seeing you there, if you are not, you may be missing out on some critical debate at a critical time. It is not too late to change your mind, and we know from experience that they do take walk-ins.
Energy
The strikes at the Chevron facility in Australia are impacting the LNG market, but for the moment, there is not the panic that this would have caused a year ago. European inventories are high, and the weather is being cooperative. Asia still needs more LNG, but the winter season has not yet started. A prolonged shutdown in Australia would be much more significant, but the market is not anticipating that. A second incident with a substantial export facility would likely cause one of the panic spikes we saw last year, but it may also bring the parties in Australia back to the table. So far, we have not seen the hint of a hurricane along the Texas Gulf Coast, same as last year, but this is unusual, and we would not bet against one. Separately, as we noted yesterday, we do not see $100 per barrel as a motivator for Saudi, as implied in the headline below – we think that OPEC has a more somber view of global economic growth and is trying to prevent a price drop. Recent production moves by the group have been strong leading indicators of economic changes.
Exhibit 24: Can we expect Gas price volatility and spikes this winter? Why? We highlight recent strength in Asia natural gas amid issues in Australia, which suggests any potential disruptions to global natural gas flows can have a notable impact.

Source: Bloomberg, C-MACC Analysis, September 2023
Exhibit 25: US natural gas prices have fallen relative to USGC ethane, while Brent Crude has risen compared to Ex-US naphtha.

Source: Bloomberg, C-MACC Analysis, September 2023
Weaker Economic Signs
China continues to cut prices/costs to try and stimulate demand, and so far, the effect is minimal. We could argue that the trade data would be even worse without the lower prices, but we are not seeing volumes improve even with the step-down in pricing. Lower interest rates may help some homeowners or potential homeowners, but the scale of the housing market problem in China will likely not be fixed that easily. That said, despite the geopolitical and instability issues, China is increasingly looking like a good place to make things, and the country has recently embarked on a strong green shift focused on green hydrogen. As we have noted in prior work and above, China is making it very difficult to ignore the cost opportunity, and thinking about the country as a manufacturing base for export rather than to chase domestic demand may be the new norm. Those pursuing chemical and polymer investments in China today that were supposed to contribute to a self-sufficiency push, may now need to look at the investments as opportunities to export – much more challenging when you have a product where the cost is dominated by a globally traded commodity rather than cheap construction costs or cheaper labor.
For many of the national security and over dependence issues that Europe and the US talks about with respect to China, cheap local surpluses may struggle to find their way into the developed Western economies. However, they could flood the rest of the world and any emerging economy looking to improve infrastructure, and with improving pr-capita wealth to buy durables will find the price argument from Cina hard to resist. Also, despite incentives that the US and Europe may be offering to either attract new investment or protect existing industries, multinational companies will recognize that they do not have to invest in China to reap the benefits of lower costs materials and fabrication in China. The Biden – World Bank headline below is a clear indication that the US sees this as a risk.
Exhibit 26: China’s exports and imports fall in August as weak global demand keeps its economy under pressure.

Source: LSEG Datastream, Reuters, September 2023
Exhibit 27: We highlight the quarterly Chinese export index through mid-2023 in terms of value relative to price, to show that volume is improving and most of the most notable downtick in Chinese exports is being driven by lower prices.

Source: Bloomberg, C-MACC Analysis, September 2023
We note the implied pessimism in the Saudi/Russia crude oil production cuts above and it is hard not to agree when we see the headlines that appear each day. While there are always a handful of bright spots the average is generally negative, and another poor showing from Germany below sets the scene well for Europe. One of the headlines below is something we have touched on before but will become a more mainstream topic over the next year, which is how the rest of the World will view the US as we go through yet another very divisive election cycle, with one partly disagreeing with another on policy just to disagree and regardless of the potential implications for things like foreign relations. The US election and its potential fallout is something else to add to the list when considering investing in the US if you are a domestic or foreign company. The US wants reshoring investment and energy transition-related investment and while there are incentives in place to help, escalating costs and the uncertainty around how policy may be impacted by the next election outcome, will likely cause many to wait.
We think that OPEC has a more “honest” economic crystal ball than most. The German data below suggests we are still circling a global recessionary drain. The Fed in the US is expressing hope rather than certainty that a recession can be avoided. Regardless, we believe that companies should be modeling slow or no growth in 2024 rather than just for the balance of 2023 and start planning accordingly. One of the risks for the world outside of North America, the Middle East, and China is that more low-cost exports emerge to undermine local industry and local economic growth. China does not have the cost advantage everywhere but is benefitting from lower crude oil prices from Russia and has the political will to keep pushing exports even if margins are break-even – this is evident in the price reductions in the export statistics.
Exhibit 28: ifo Institute Confirms German Economy to Contract by 0.4 Percent

Source: ifo Institute, September 2023
Exhibit 29: Companies in Germany Expect Lower Prices | ifo Institute

Source: ifo Institute, September 2023
The week of September 4th – click on the day or the report title for a link to the full report on our website.
Tuesday – Weekly Margin and Pricing Analysis
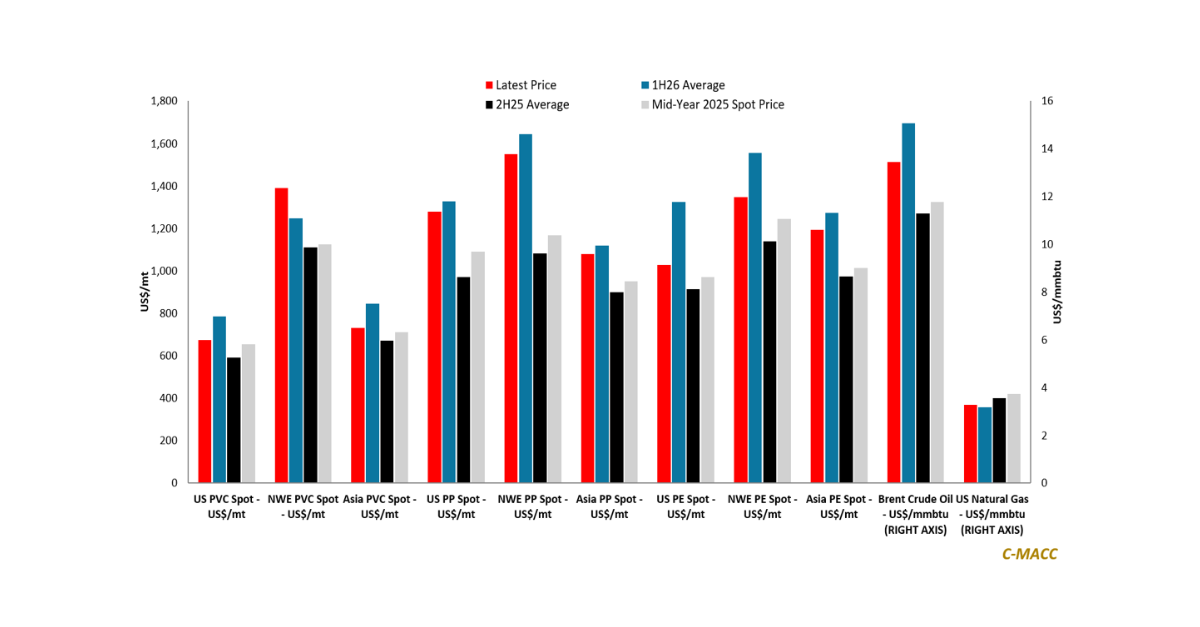
Global Chemical Update – Crude Awakening
- Global chemical prices have risen from mid-year lows, with higher crude oil and related feedstocks being a primary driver and yielding significant relative benefits for low-cost North American producers.
- NW Europe petrochemical markets saw significantly higher costs WoW and essentially unchanged prices, compressing its production margins relative to Asia and upping its potential for plant closures.
- Ex-US ammonia price strength helped pull US prices notably higher WoW, lifting domestic margins, and we reiterate our constructive near-to-medium-term profit view for domestic fertilizer producers.
Global Polypropylene Oversupply – European Cuts Begin, But Far From Enough To Offset Asia Additions
- European polypropylene prices are at a premium to the US and Asia, but integrated producer profit in this region is among the lowest globally. Production cuts are happening, not enough yet.
- Crude oil prices rose at the start of the week relative to US natural gas, pushing this feedstock ratio near five-year highs and notably higher relative to Ex-US naphtha to USGC ethane spreads.
- Singapore naphtha prices remain notably below their five-year average compared to Brent Crude, showing oversupplied conditions poised to favor Asia producers more than Europe.
- We highlight struggles emerging for a Canadian oil sands project seeking to capture carbon, GHG emissions by major shipping fuel type and show recent trends in EU and UK CO2 prices.
- German companies take a cautious view of price trends, the Baltic Exchange Index reflects rates near the low end of the five-year range, and we also flag recent US Dollar strength.
From Train To Boat: Higher US Rail Freight Suggests More US Polymer Exports – Not Good For Others
- Chemical rail traffic and commodity profit trends indicate that a North American production response is happening; this may reverse in seasonally weaker 4Q unless we push more offshore.
- The global chemical production cost curve has steepened due to recent crude oil price strength relative to North American natural gas, benefiting the US but increasing headwinds for Europe.
- The benefits of value chain integration in chemicals are rising and shielding some producers in high-cost markets – we foresee more linkages to occur across regions as a rising sector theme.
- The US offshore potential for wind-based power remains high. However, sufficient wind speed is not enough – surging project costs amid expectations for falling power prices are a headwind.
- The total value of China exports fell again in August YoY; however, volume is more supported than price, and rising low-priced Chinese product availability is a sizable Western producer risk.
From The Quest: Next Week C-MACC Travels For Answers as Uncertainty Is High & Rising On Multiple Fronts
- Part of the C-MACC team will attend the PACK EXPO conference next week, and the other part will be at the CMA World Chemical Forum – contact us directly for information on the events.
- Packaging materials markets have become increasingly opaque, and we are helping clients gain clarity into material price/cost trends and evaluating the challenges facing its sustainability push.
- Our team will also host a Hydrogen panel at the CMA World Chemical Forum, where we will target multiple parts of the value chain to highlight hydrogen’s role in decarbonizing chemicals.
- Global chemical prices will mostly close this week higher than at the start of September, led by higher crude prices and a steepening global cost curve – a plus for the US but not for Europe.
- The US harvest appears supportive of current crop prices, which supports our constructive outlook for agricultural chemical and fertilizer markets following their weak YTD performance.
Weekly Climate, Recycling, Renewables Energy Transition and ESG Report (CRETER) No 145
Decarbonization Will Take The Last Fizz Out Of Chemical Profits
- As chemical industry margins fall globally, the expense of options to decarbonize becomes a larger portion of a smaller capital pie – maybe too large.
- Escalation in cost estimates for clean projects does not help: US offshore wind is the best current example – higher power cost expectations will change many plans.
- Despite losses in chemicals, China is pushing ahead with green/clean projects quickly. Costs are low and low-cost/low-carbon products from China are coming.
- The shipping fuel debate continues, and the only broad agreement is that change is coming – we see roles for methanol and ammonia – skeptical about hydrogen.
- Otherwise, we look at other challenges with blocking China’s influence in energy transition, and we talk about the consequences of higher power costs from wind.
Weekly Hydrogen Economy Update No 10
Pushing The (Clean) Boat Out – The Largest Need for Hydrogen
- We look again at prioritizing the use of hydrogen this week and focus on shipping as the industry is effectively split between methanol and ammonia, both of which need abundant clean hydrogen.
- Near-term global market dynamics have depressed ammonia and methanol pricing, and this has influenced investment progress as current economics play a large part in investment decisions.
- But the recent turn in ammonia pricing may be a trend that would get investors interested again. Current prices are below what would be needed to get green ammonia moving, but maybe not blue.
- Methanol is more of a challenge as you need a source of CO2; ideally an existing one to get the clean label when using green or blue hydrogen; the cost of the CO2 may matter more than methanol pricing.
- Of course, the other option is to find customers willing to pay more – and we note a recent LinkedIn post from the LSB CEO making the same point last week. Anything can get done if the price is right.
 Loading…